In an earlier post, I mentioned that Chien-Yi has been adding a lot of functionality to the mapping piece of DH Press. Again, while the tool (we hope) is evolving well beyond just a geo-spatial visualization tool, we nonetheless want a robust mapping component to the plugin.
Map Library
First and foremost, DH Press will feature an extensible Map Library. Any map in your Map Library can be used in a project (just like items in your WordPress media library).
Chien-Yi has already loaded in all georeferenced maps served out by the Carolina Digital Library and Archives. If you need, say, the 1913 Sanborn map of Durham, all you have to do is search for it and select it. But if you need a map not already in the Library, we hope it will be easy to add. DH Press can currently support a range of base maps, CDLA maps of NC, KML maps, and other OpenLayers maps (although some API customization may be required to import other map libraries).
Base Layers
Whether your project requires a (historic) overlay or not, every map will have some sort of base layer when rendered to end users. Typical base layers include a range of Google Maps (street, satellite, hybrid) and OpenStreetMaps. We’ve also talked about adding in Bing Maps. Admin users will be able to set the base map layer, but can also allow end users to change the base layer (if more than one base layer is assigned to a project).
It will also be possible to upload your own customized KML base layer. That is, if you’ve created a map of your own using ArcMap, for example a set of polygons related to different neighborhoods in a city, you can upload it into the tool and use the KML, with all of its associated data, as the base layer. The KML will need to be served out from somewhere, though we think it will be possible to load it in as a media file into DH Press and serve it out locally.
Overlays
If your project requires it, you can also layer one or many maps over your base map. Currently, two main map types are supported: KMLs (again, these must be served out from somewhere) or CDLA Maps. But of course, we’re hoping to keep extending this map set, using map APIs whenever possible. Once we set this up, it should be fairly easy to add a new map overlay to your Map Library. By pasting in a URL and adding some accompanying metadata, you should be able to create new maps and add them to your projects. Because we’re using the OpenLayers protocol, pulling in OpenLayers maps should be fairly straightforward for us. We’re also exploring what it would take to pull in other geodata, such as datasets from PostGres/PostGIS, or Web Mapping Services (WMS) streaming geodata.
Map Legends
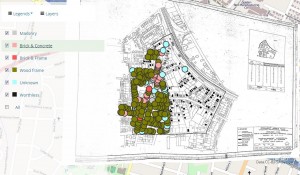
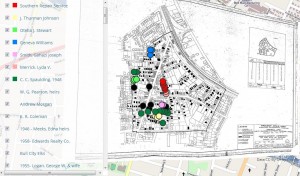
After you’ve added your maps to the Map Library and associated a particular map(s) with your project, you’ll be able to create as many map legends as possible, where you can specify your marker types, and assign filter fields. So, depending on what map view you’re in, you could see markers differentiated by different values associated with different attributes. For instance, here are two views of the same set of markers, one filtered by building type, the other by property owner. The different map legends allow you to visualize different attributes of your data.
We’ll continue adding even more map functionality after the Beta 1.0 release, so stay tuned!


